Welcome to the Racial Equity Data Lab, a space where you can create data visuals and dashboards to support your campaigns for racial equity and inclusive recovery.
Starter Visualization
Create your own $15/hour fact sheet.
Our $15/hour starter visualization provides data and policy solutions to advance wage equity in Dallas. Use it as a template to customize a $15/hour fact sheet for your community. Click here to share your customized starter viz fact sheet with us!
Data Visualization Tools
Learn how to make powerful equity visuals.
Clear and compelling data is essential to advancing equity campaigns. Learn how to design dashboards that make the case for equity and support transformative policy change in your community. Click here to get started.
Tableau-Ready Data Sets
Access Atlas data to build your dashboards.
Use these starter workbooks and data sets to create Atlas-powered data visualizations.
Gallery
View racial equity data visualizations.
Explore examples of data visualizations created by the National Equity Atlas. Learn more about the strategic design and approach of the Atlas team in creating each data product.

National Equity Atlas Fellowship Showcase: Cohort 1
Showcasing the equity data projects of the inaugural cohort of National Equity Atlas Fellows.
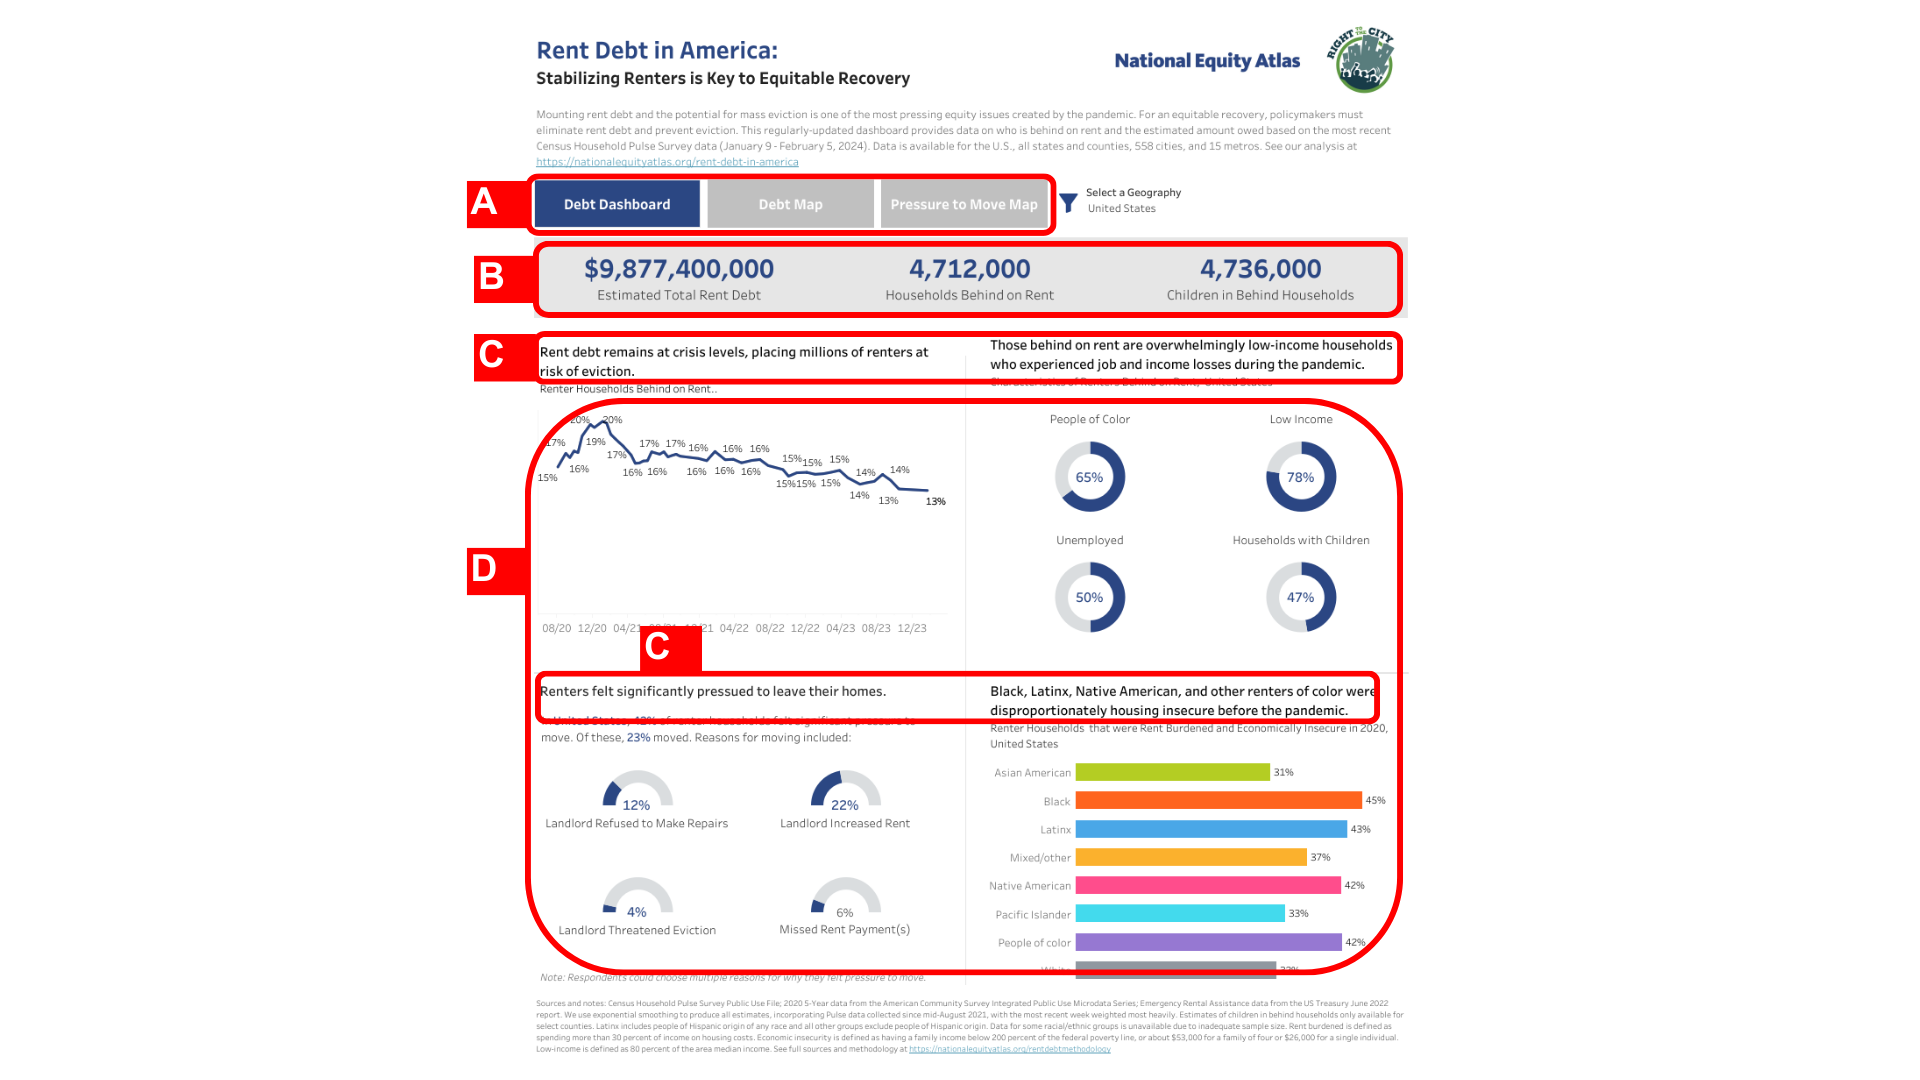
Dashboard: Rent Debt in America
Learn more about our approach to designing the Rent Debt in America dashboard.
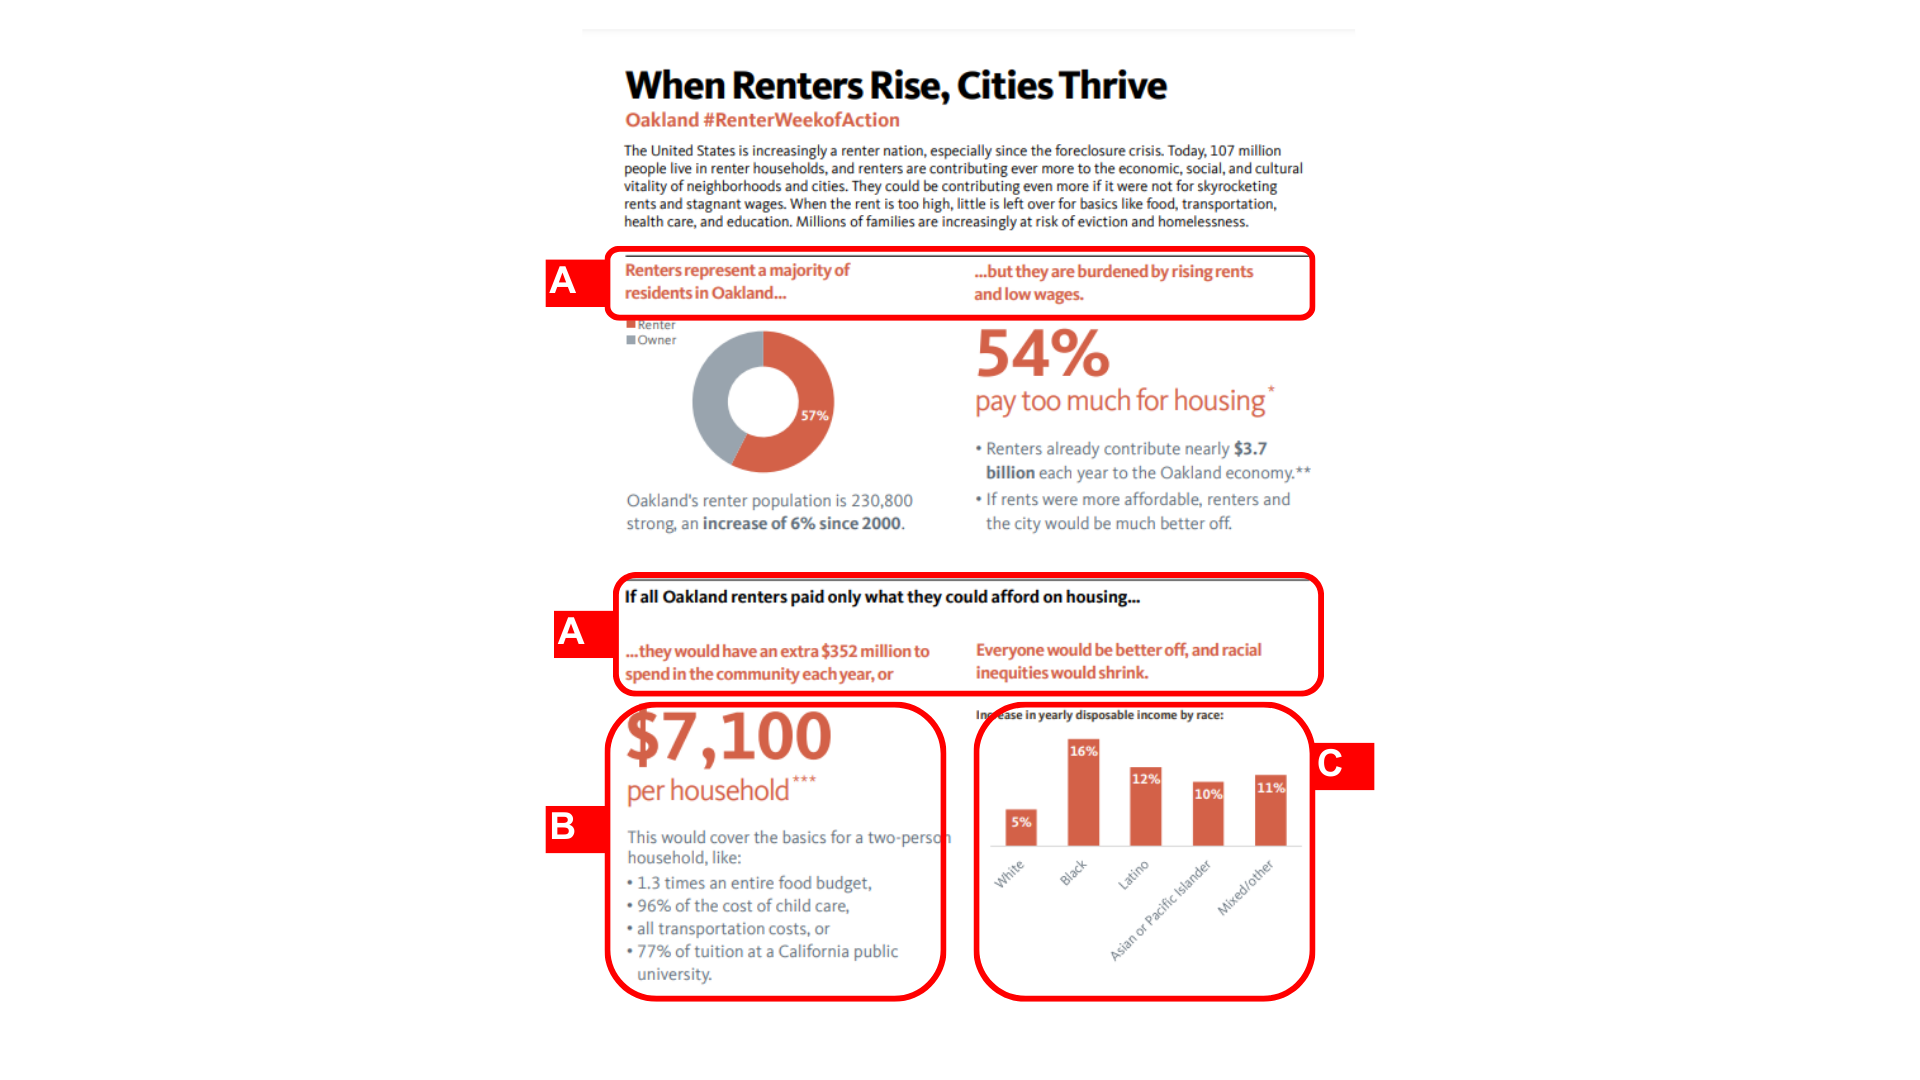
Fact Sheets: Renter Week of Action
Learn more about our approach to designing the Renter Week of Action fact sheets.
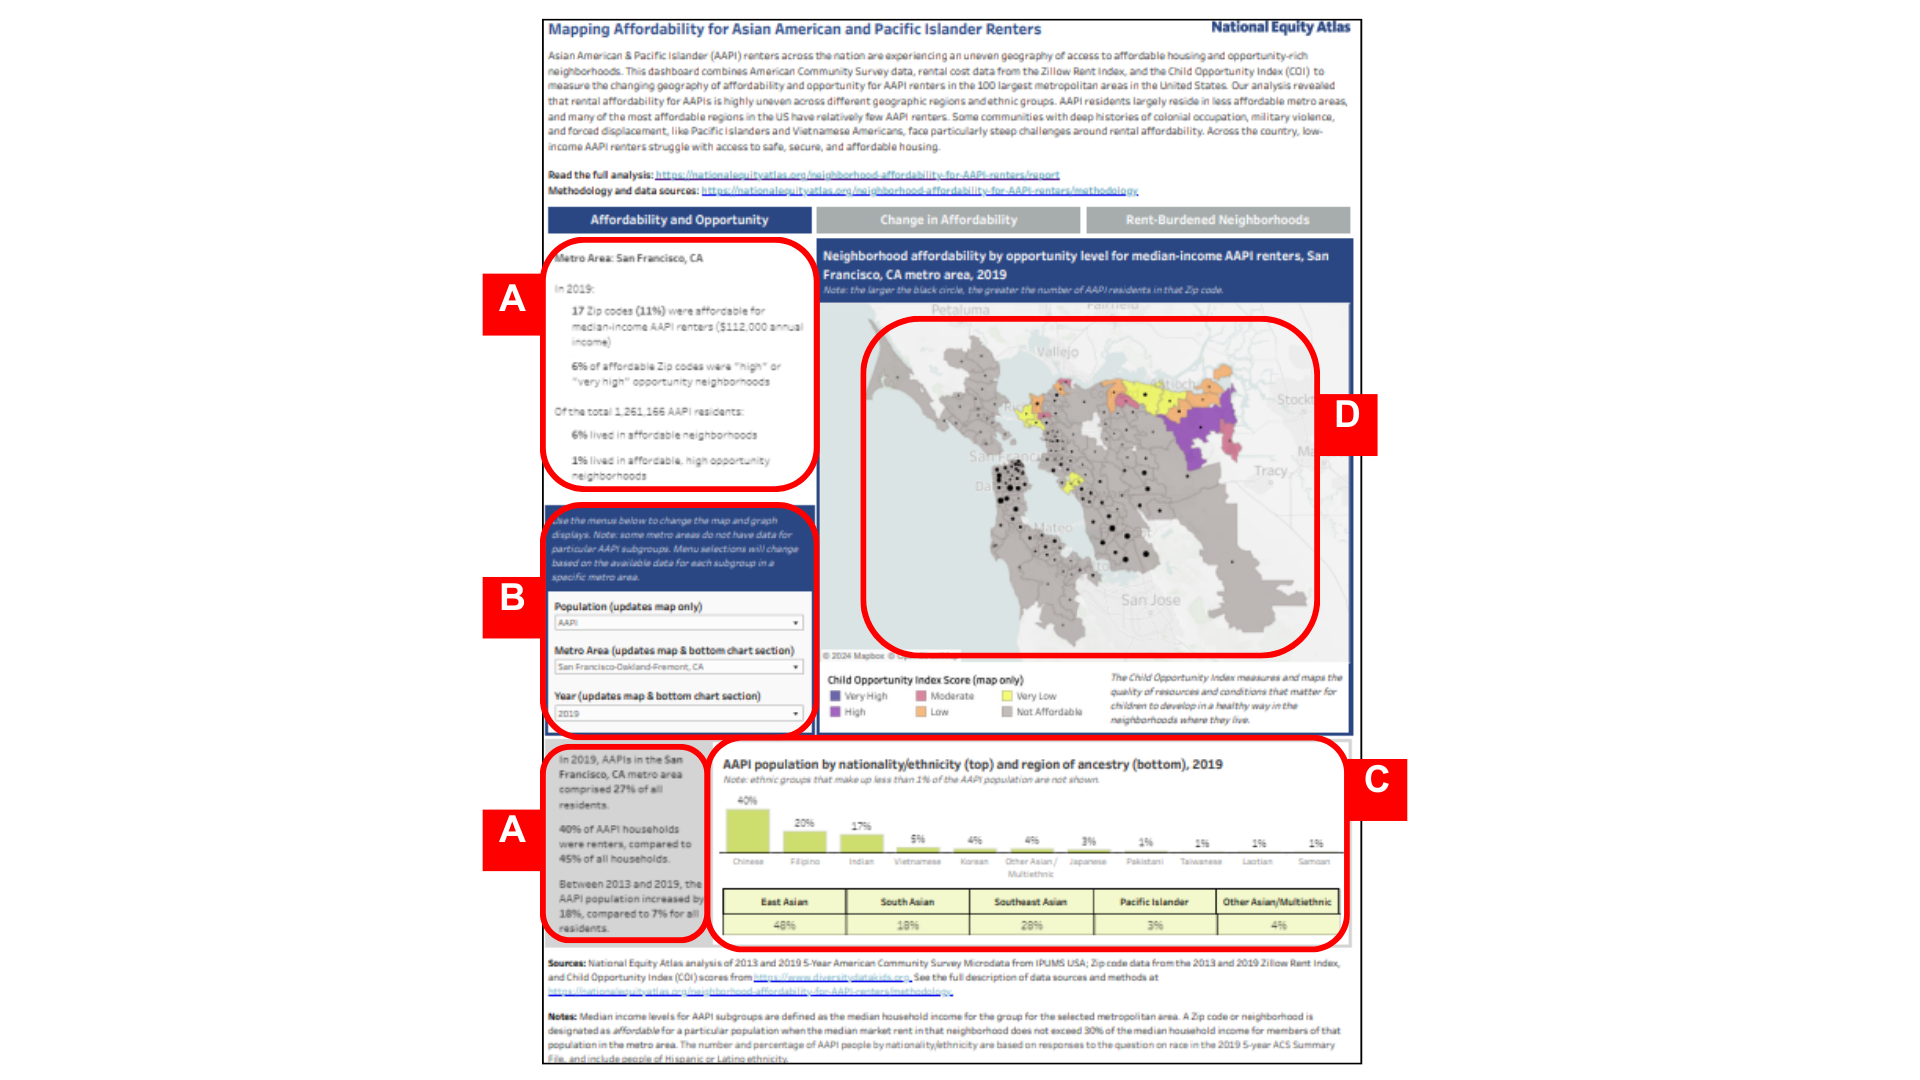
Dashboard: Mapping Affordability for Asian Americans and Pacific Islanders Renters
Learn more about our approach to designing the Mapping Affordability for Asian Americans and Pacific Islanders Renters Dashboard.
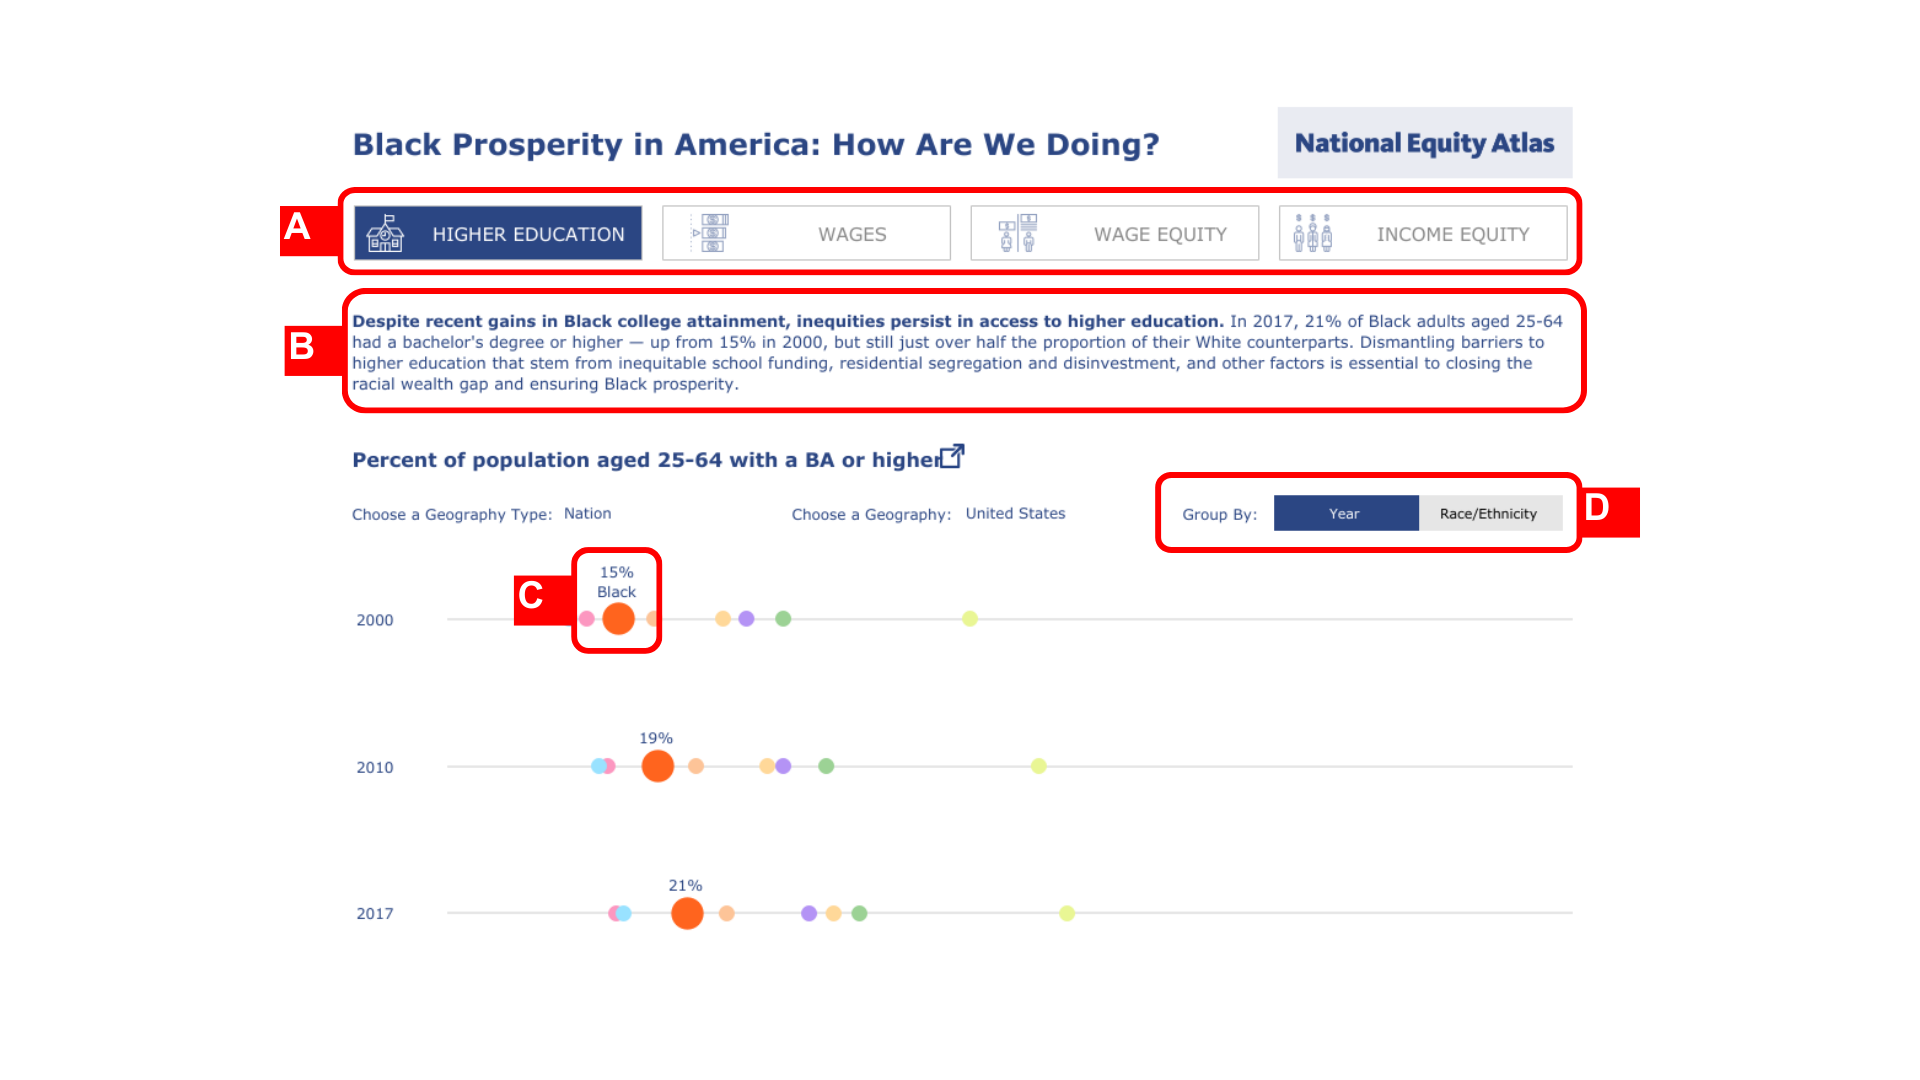
Dashboard: Black Prosperity in America
Learn more about our approach to designing the Black Prosperity in America dashboard.
Contact Us
We'd love to hear about how you are using the Lab, answer your questions, and see the visualizations you are creating! Please email Selena Tan at selena@policylink.org. Also, sign up for our email list below to get updates about the Lab.
We are grateful to the Tableau Foundation for supporting the Racial Equity Data Lab.

