Poverty
No one should experience poverty or economic insecurity. Poverty remains high in the United States because of various historical factors such as racial segregation and policies that banned people of color from accessing education and higher paid professions. Ongoing factors, like decades of disinvestment in infrastructure and social programs, discriminatory hiring practices and disparities in generational wealth, also contribute to poverty. The Poverty indicator measures the percentage of the population living below the indicated federal poverty threshold based on their family income, size, and composition.
Step 1: Go to the Poverty Starter Workbook page in Tableau Public.
Step 2: Download the workbook and open in the Tableau Public App. Instructions on downloading the Tableau Public App can be found on our Using Tableau page.
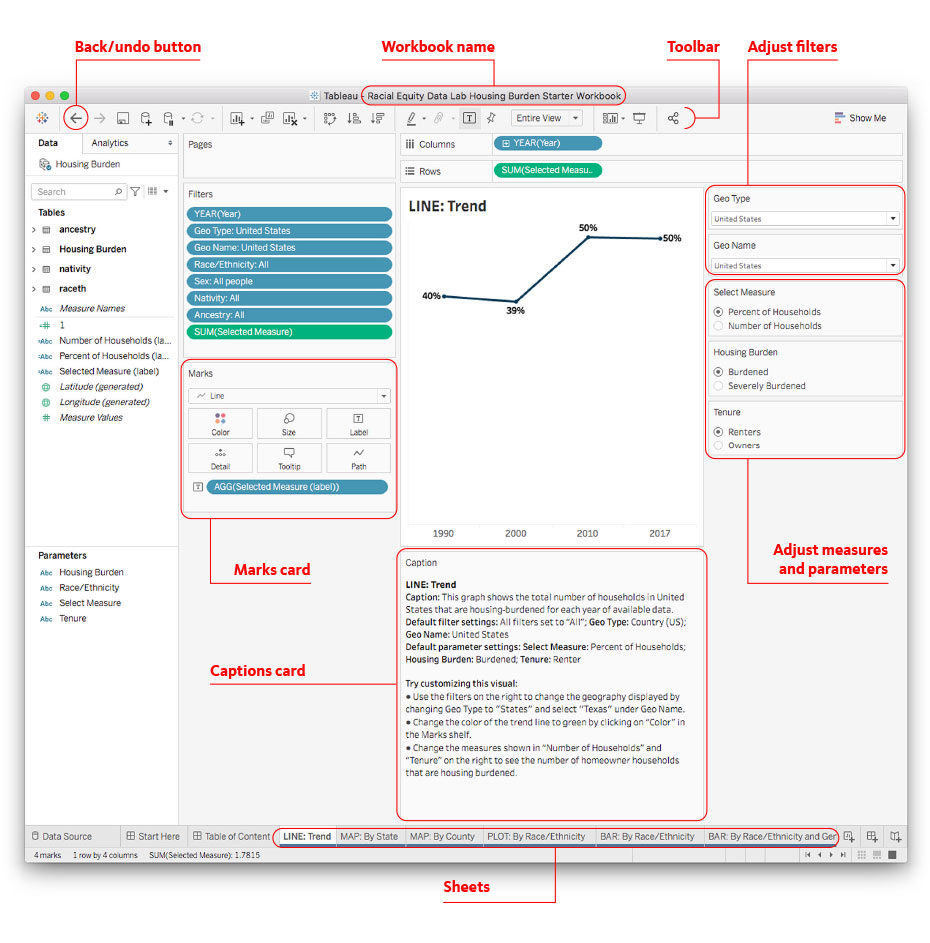
Tableau Workbook Layout

- Use the instructions on the Start Here sheet for more information about the workbook features.
- The Table of Contents sheet lists all the example charts available in the starter workbook.
- The Caption card below each data chart type provides instructions for understanding the data as well as some suggested customization options.
- Use the Filters on the right side of the Tableau workbook for each sheet to adjust Measures and Parameters.
- Adjust colors in the Marks card.
- If at any time you want to un-do a step, use the back button in the top left corner of the workbook screen, or refer to the default settings in the Caption card to reset the chart.
- Follow the steps on the Publish sheet to export and download your visualizations.
To learn more about the Tableau workspace and icons, click here.