Explore examples of data visualizations created by the National Equity Atlas. Learn more about the strategic design and approach of the Atlas team in creating each data product.

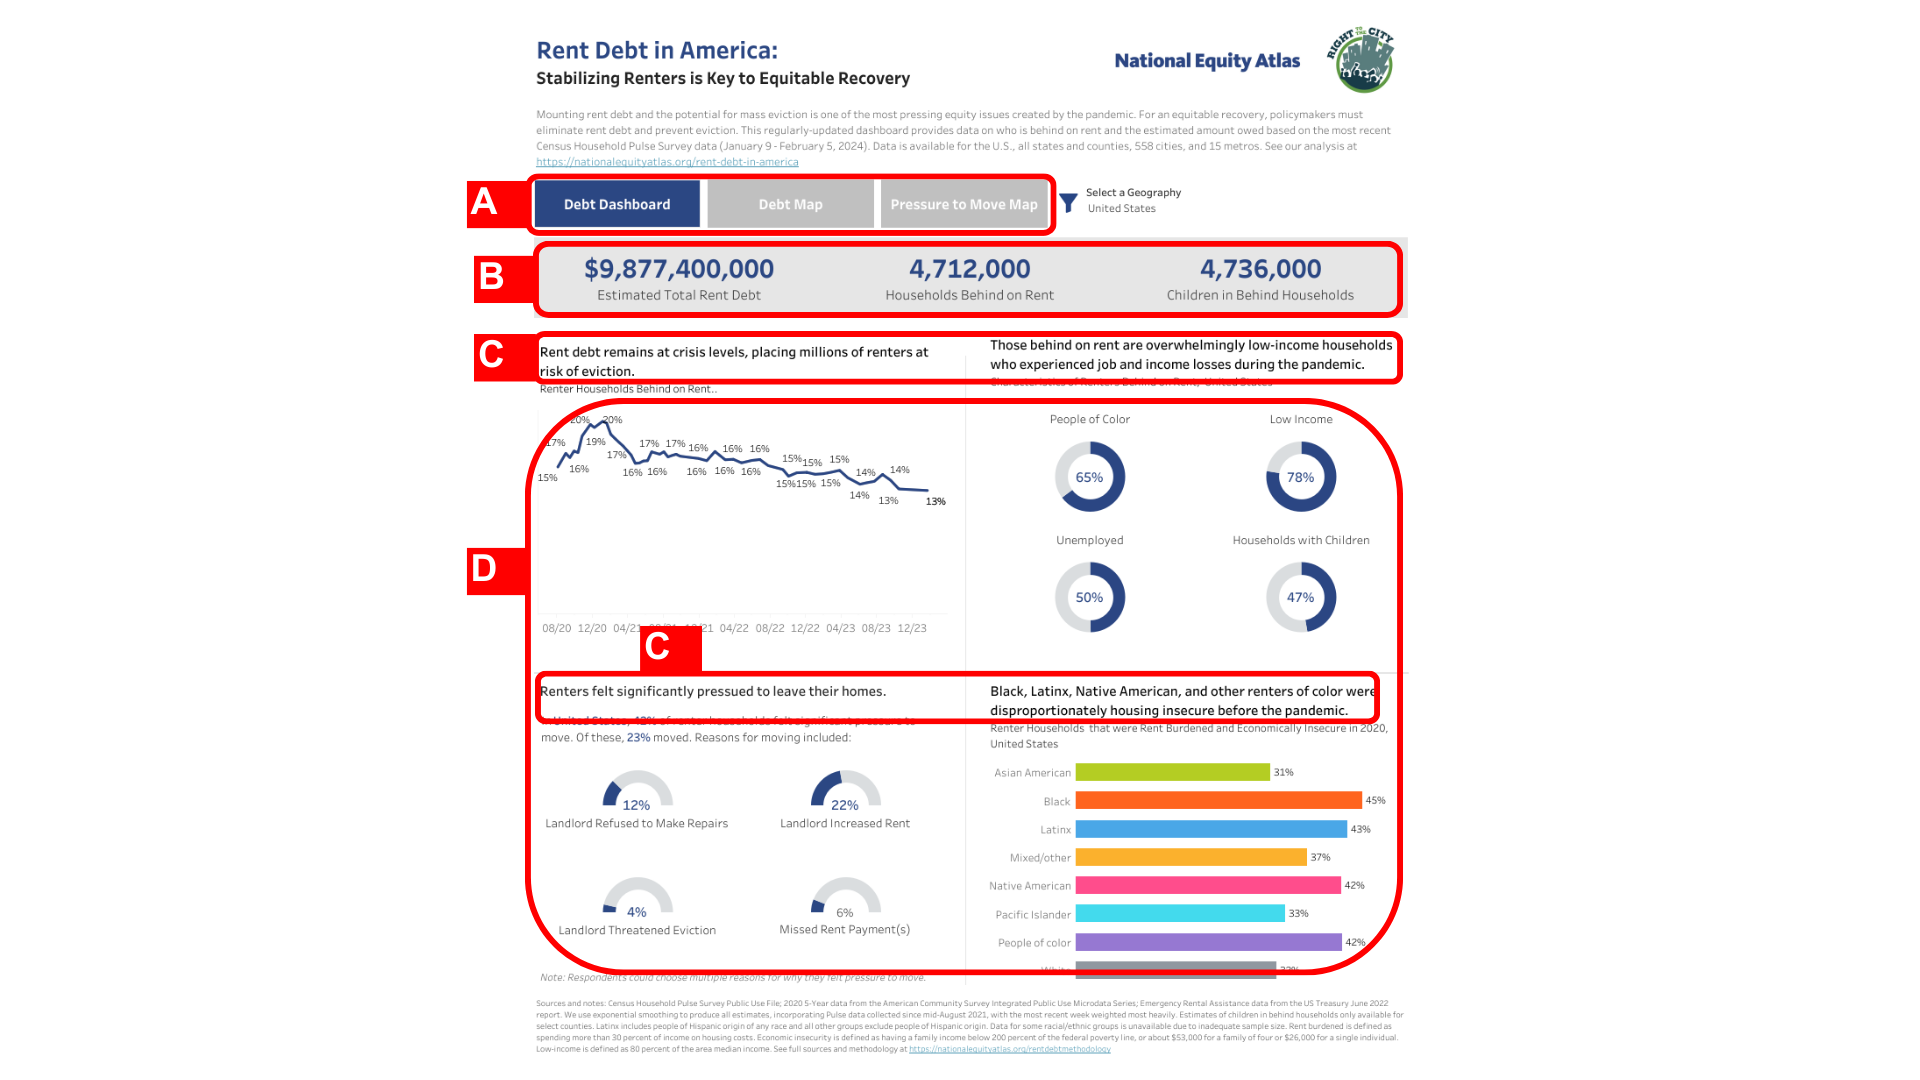
Dashboard: Rent Debt in America
March 21, 2024
Learn more about our approach to designing the Rent Debt in America dashboard.

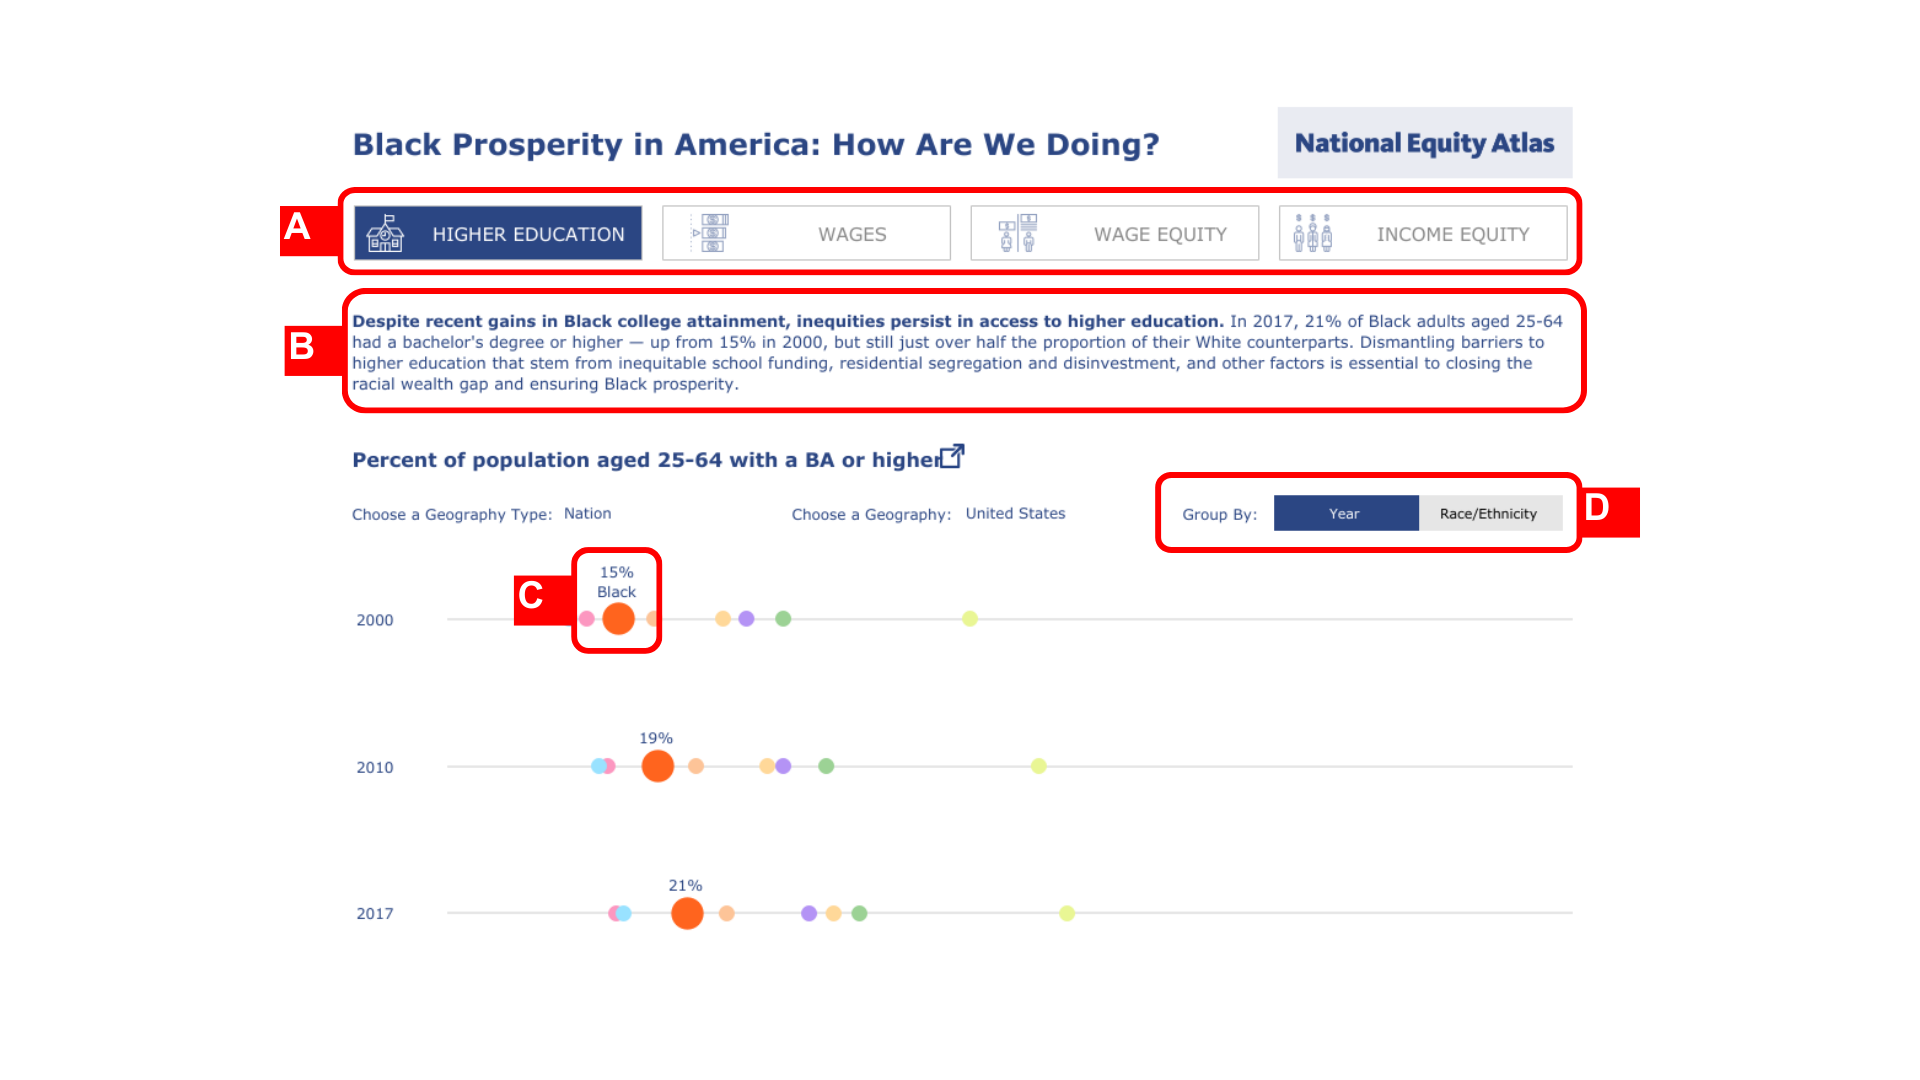
Dashboard: Black Prosperity in America
March 21, 2024
Learn more about our approach to designing the Black Prosperity in America dashboard.

Dashboard: Tracking California's Rent Relief Program
March 21, 2024
Learn more about our approach to designing the Tracking California's Rent Relief Program dashboard.

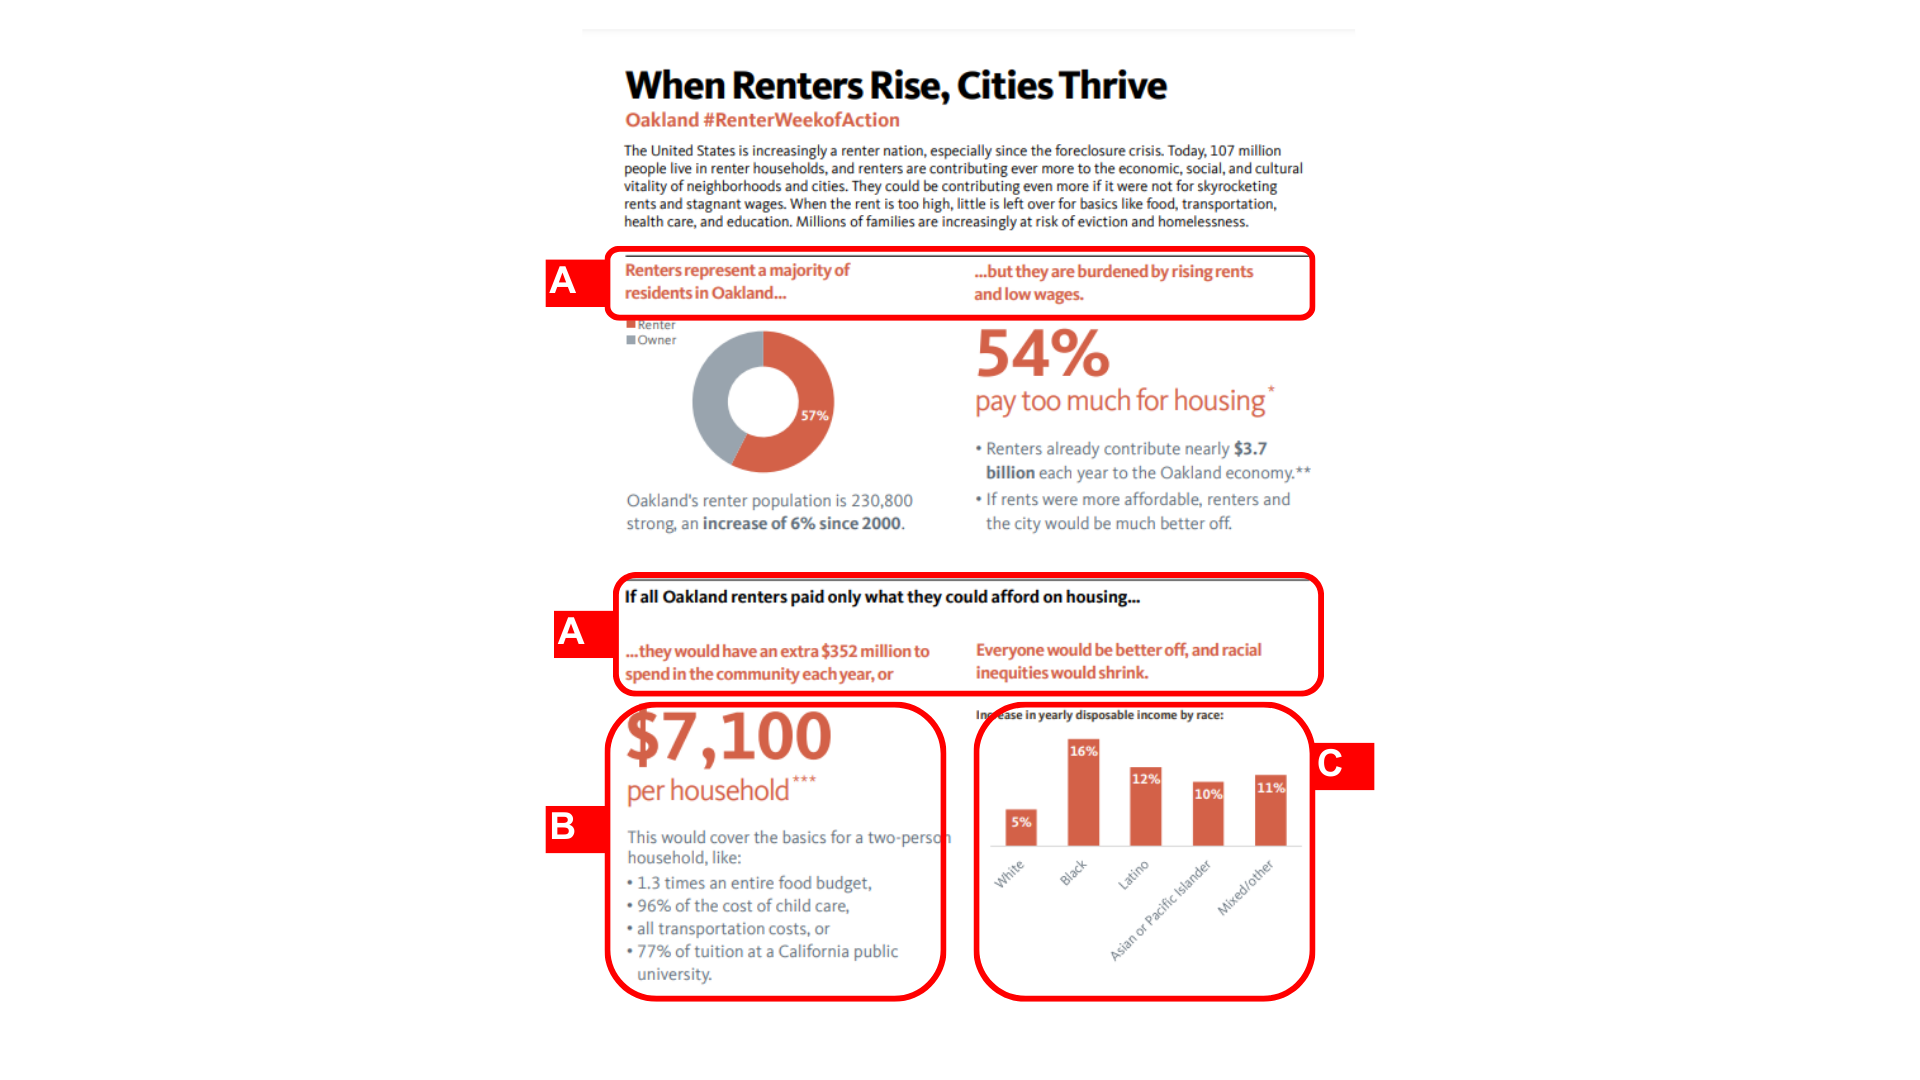
Fact Sheets: Renter Week of Action
March 21, 2024
Learn more about our approach to designing the Renter Week of Action fact sheets.

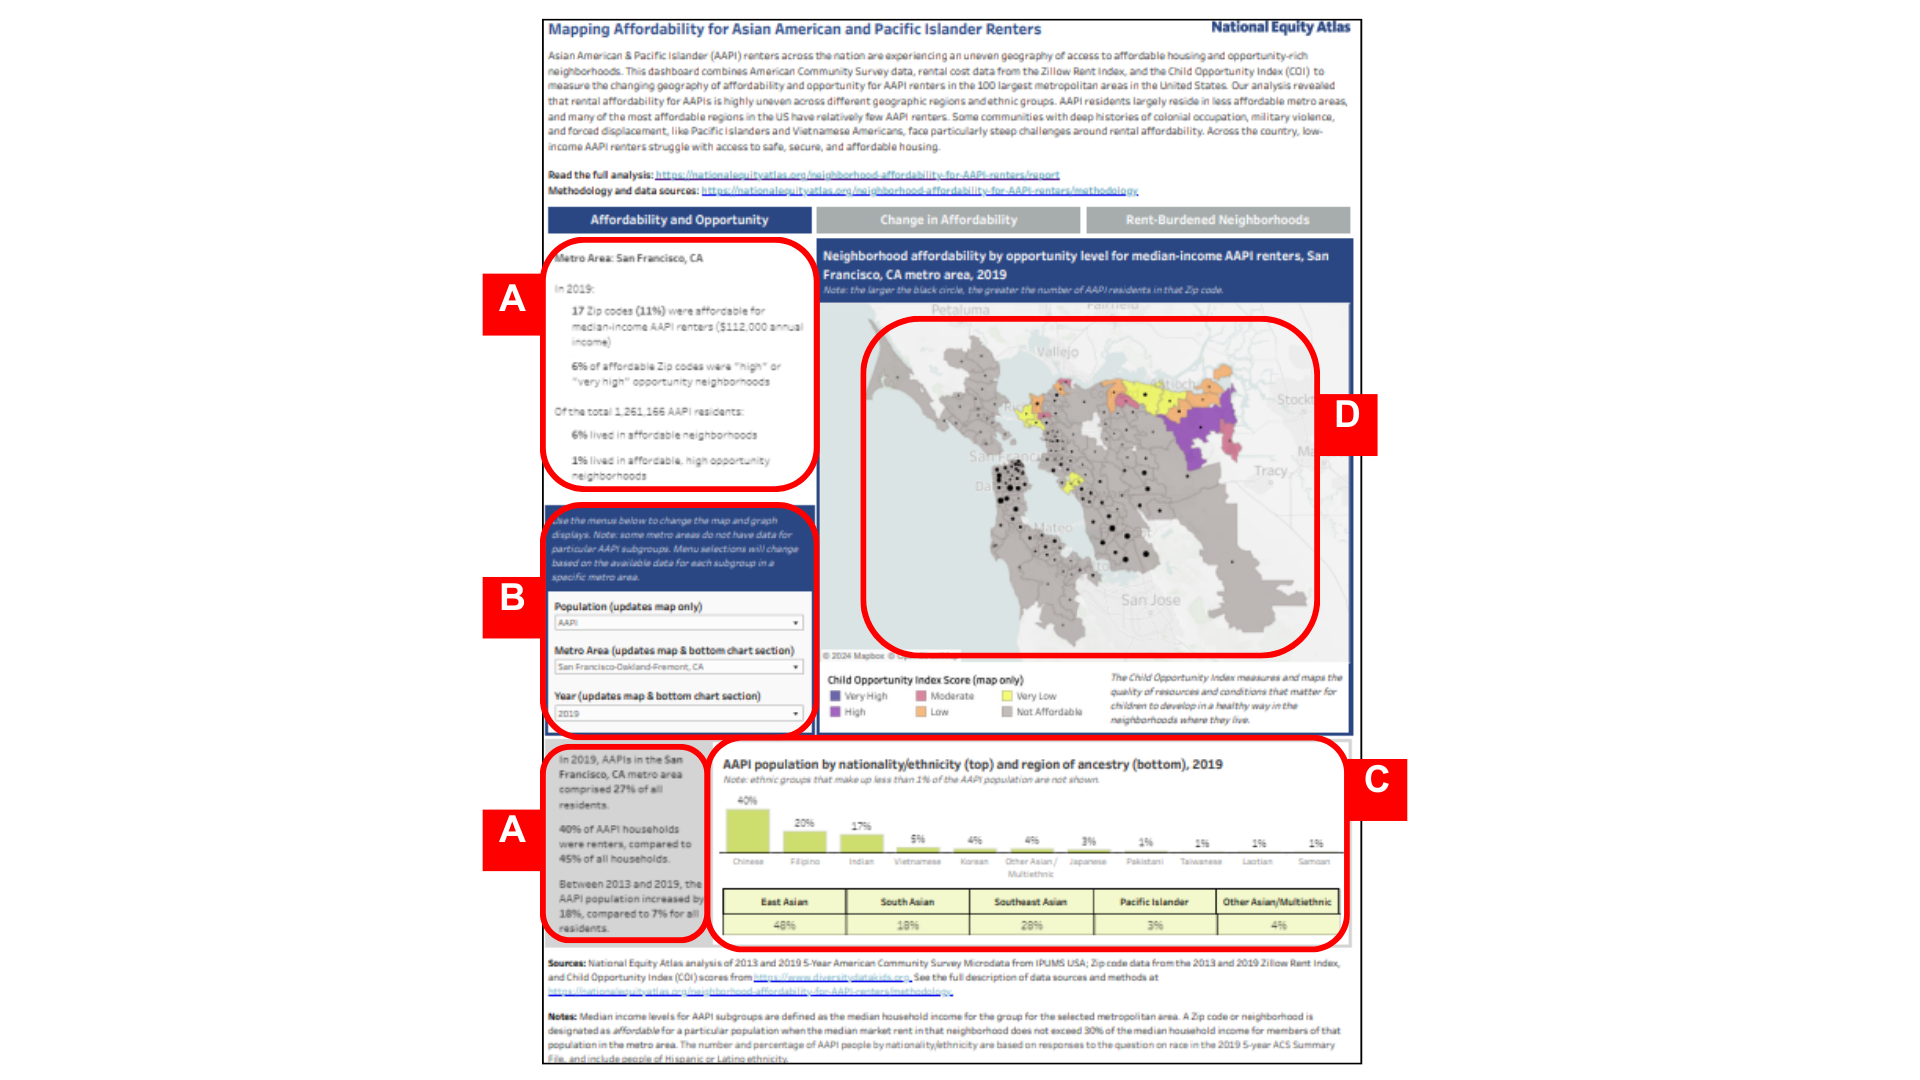
Dashboard: Mapping Affordability for Asian Americans and Pacific Islanders Renters
March 21, 2024
Learn more about our approach to designing the Mapping Affordability for Asian Americans and Pacific Islanders Renters Dashboard.