How We Define Affordability
We define an affordable zip code as one where renters making the median household income (MHI) in that particular metropolitan area spend 30 percent or less of their income on housing if they pay the median market rent for that zip code. For instance, if the MHI in a given metro area is $100,000, a household making that amount would find a particular zip code in that same metro affordable if the median market rent in the neighborhood was no more than $30,000 a year, or $2,500 a month. Were this household to pay more than $2,500 a month in rent, they would meet US Department of Housing and Urban Development (HUD) definitions for being rent burdened.
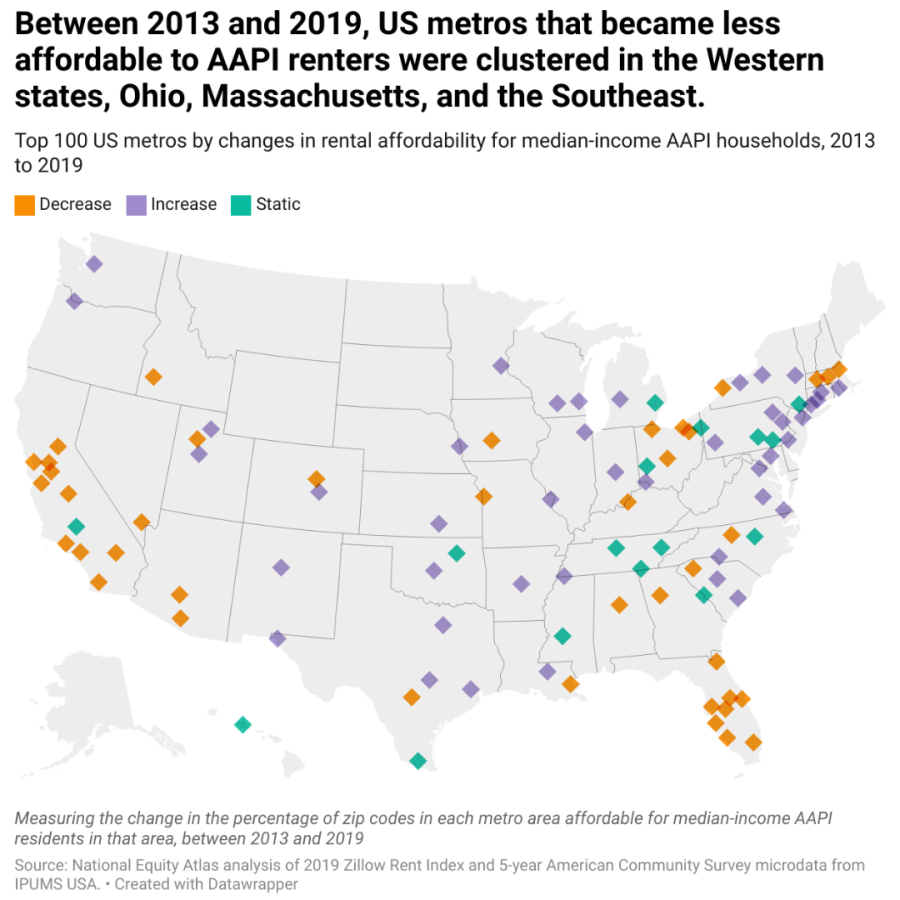
Given widespread trends in racial and class segregation, it is commonplace for some zip codes in a single city to be affordable to the median household, while other neighborhoods are not affordable. It is also possible for a single zip code to switch from affordable to unaffordable (or vice versa) over time if market rents increase faster than area median incomes during that span. In this study we examine data from two years, 2013 and 2019, to assess changes in affordability across the 100 largest US metropolitan areas (“metros” or “metro areas” for short) during the period of economic recovery between the Great Recession and the Covid-19 pandemic.
Within every metropolitan area, we can calculate the median household income for the entire population, as well as separate MHIs for population subgroups, like racial or ethnic groups. Median incomes for Black, Latinx, Asian American and Pacific Islander (AAPI), and white households often vary within a metropolitan area, which can indicate broader structural disparities with uneven impacts across populations. This means that a given zip code can vary in affordability depending on the racial group (e.g., if a median AAPI household could afford the median market rent in that neighborhood but a median Latinx household would be rent-burdened at the same cost).
In the report, we use shorthand language for the sake of readability. When we state that “X neighborhood was affordable for AAPI residents,” we mean that the neighborhood had a median market rent of less than 30 percent of the median household income for AAPI residents in that metropolitan area.
Data and Methods
To answer our research questions, we synthesized data from 2013 and 2019 across three main datasets:
1. Zip code-level data on median market rents from the Zillow Rent Index (ZRI). The ZRI is a data tool that determines the median market rent (the median monthly cost of for-rent units) within a given geographic area for a given year. ZRI data focuses on the cost burdens for households searching for available rental housing in that area, not the cost of all rental housing units in that area. Incumbent renters, who are more likely to have lower rents and/or smaller rent increases, are not included.
ZRI is a summary measure of neighborhood affordability, not a precise measure. After all, the median market rent indicates the price point at which half of all rents cost less, and half cost more. Even if we deem a given zip code unaffordable for the median household based on the median market rent, it is still possible that there are some rentals within that zip code that are affordable for the median renter. However, these affordable rentals are not plentiful, which makes the zip code financially restrictive from a macro level.
It is important to note that median monthly costs reflect listed or “asking” rents, which may or may not include the cost of utilities. As such, this measure is a proxy for the definition of rental burden set forth by HUD, which includes rent and utilities as a percentage of income.
In 97 of the 100 regions under analysis, Zillow’s data covers at least 80 percent of the renter household population in both 2013 and 2019. The three metro areas with data for less than 80 percent of the renter population are Youngstown-Warren-Boardman, Ohio/Pennsylvania (79 percent); Rochester, New York (77 percent); and Augusta-Richmond County, Georgia/South Carolina (58 percent).
2. Metro area-level data on median household incomes from the 5-Year American Community Survey. This report utilizes the MHI for all residents within each metro area regardless of race/ethnicity, as well as the median income in each metro for all AAPI households combined. In addition, we calculated the 2013 and 2019 MHIs in each region for four major AAPI subgroups (East Asians, Southeast Asians, South Asians, and Pacific Islanders) and the six most populous Asian ethnic groups (Chinese, Filipino, Indian, Korean, Japanese, and Vietnamese). To merit inclusion within our dataset, the MHI for a given region had to include at least 100 household responses in the ACS. This means that MHI data are not available for some AAPI populations (particularly Pacific Islanders) in smaller metro areas, where the sample size was too small.
In this report, the terms “median-income AAPI households” and “AAPI households at the median income” refer to AAPI households at the median household income for AAPI households within that metro. Additionally, the term “AAPI household” is shorthand for a household enumerated in the American Community Survey with an AAPI householder, e.g. the family member who completes the ACS on behalf of the entire household. This means that the people living in so-called “AAPI households” are not necessarily all AAPI, as households do not always fall within neat demographic boundaries.
We included median household incomes for all households in a given metro area, not just rental households. Homeowners can become renters and vice versa, and by including data from all households we can explore racial inequities in rental affordability more broadly.
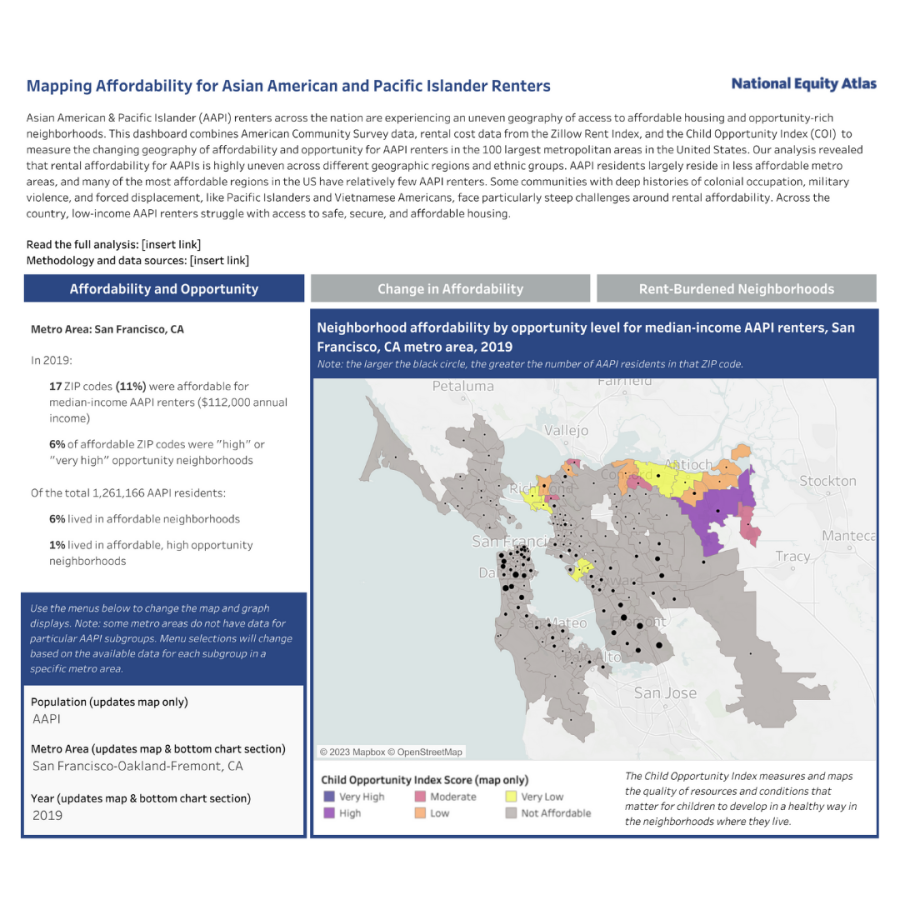
3. Zip code-level data from the Child Opportunity Index (COI), a metric devised by researchers at Brandeis University. The COI provides a relative measure of livability for children and families by scoring each neighborhood (here, zip code) along 29 indicators of opportunity across three domains: education, health and environment, and social and economic. Each zip code falls into one of five levels of opportunity (quintiles): “very high,” “high,” “moderate,” “low,” and “very low.”
We use the COI to examine the local opportunities within the neighborhoods that are affordable to median renters in a given metro. Rental affordability alone cannot ensure economic stability if the only affordable neighborhoods are in areas with existing structural disparities in health, education, employment, and other key service systems. Two metrics are of particular importance: the percentage of affordable zip codes that are high-opportunity (a COI of “high” or “very high”), and the percentage of high-opportunity zip codes that are affordable for a given population.
4. Discussions with AAPI housing justice organizations, policy advocates, and community service providers. National Equity Atlas staff conducted informational interviews with staff from 14 AAPI-led and -serving organizations across the country to cross-check our findings with practitioners’ and advocates’ experiences with the challenges that low-income, immigrant, and limited English-proficient AAPI renters face in their respective communities. We have integrated their insights, observations, and policy considerations throughout this analysis. A full list of organizations that we consulted is listed below:
• Asian Americans Advancing Justice - Atlanta (Atlanta, Georgia)
• Asian Pacific American Network of Oregon (Portland, Oregon)
• Chinese American Planning Council (New York, New York)
• City Fabrick (Long Beach, California)
• Coalition for Asian American Children and Families* (New York, New York)
• Hamkae Center (Annandale, Virginia)
• HANA Center (Chicago, Illinois)
• Hawaii Appleseed Center for Law & Economic Justice (Honolulu, Hawaii)
• Hawaii Budget and Policy Center (Honolulu, Hawaii)
• National Coalition for Asian Pacific American Community Development* (Oakland, California)
• OCA-Asian Pacific American Advocates* (Washington, DC)
• Orange County Asian Pacific Islander Community Alliance (Garden Grove, California)
• Philadelphia Chinatown Development Corporation (Philadelphia, Pennsylvania)
• Southeast Asia Resource Action Center* (Washington, DC)
* Denotes an organization that has a national scope.
A few additional notes on the terms and methods we use in this report:
• To capture the diversity of the Asian American and Pacific Islander community we present data for more specific racial/ethnic subcategories within these groups. To be considered in this analysis, respondents to the census survey must identify as Asian or Pacific Islander regardless of what additional races they report. Respondents were then sorted into racial/ethnic subcategories based on the first response to the census question on ancestry, recorded in the IPUMS variable “ANCESTR1.” As part of the analysis, all people included in our analysis were assigned to one of four racial/ethnic aggregated subcategories to aid our analysis.
- “South Asian” is used to refer to all people who identify with any of the following ancestry categories: Bengali, Indian, Pakistani, Sri Lankan, Nepali, Bhutanese, or Other South Asian.
- “Southeast Asian” is used to refer to all people who identify with any of the following ancestry categories: Burmese, Vietnamese, Cambodian, Hmong, Laotian, Thai, Indonesian, Filipino, or Other Southeast Asian.
- “East Asian” is used to refer to all people who identify with any of the following ancestry categories: Chinese, Japanese, Korean, Taiwanese, or Other East Asian.
- “Pacific Islanders” can refer to anyone identifying as Native Hawaiian or Pacific Islander alone or in combination.
• “Low-income household” is a term that can have either a loose, quantitative meaning (e.g., a household with members working in low-wage occupations or industries) or a precise definition based on HUD standards (i.e., a household earning 80 percent or less of the median income for the given metro area — the area median income (AMI)). We clarify when “low-income” refers to the latter (80 percent of the AMI). By contrast, households earning 100 percent of the AMI are “median-income,” and those earning 120 percent of the AMI are “moderate-income.”
• While we refer regularly to “zip codes” in this report, we are actually using ZIP Code Tabulation Areas, or ZCTAs, as our smallest geographic unit to align Zillow Rent Index and Child Opportunity Index data. ZCTAs are a designation that the US Census Bureau uses to produce the decennial census, whereas zip codes fall under the purview of the US Postal Service and aid in the delivery of mail. While zip codes and ZCTAs broadly overlap, zip codes are more liable to change boundaries and numbers over time. As such, ZCTAs are useful for stabilizing longitudinal data analyses that compare the same regions over time. However, “zip codes” is a more familiar shorthand for the sake of our reporting.


